


What Is a 52-Week Low?
A 52-week low is the lowest price at which a stock, commodity, or other security has traded during the past 12 months. This benchmark is widely monitored by traders and investors as it highlights a point of potential market pessimism and identifies opportunities for value-based investments. This measure is not a prediction of future price movements but serves as a historical snapshot of how the asset has performed over the past year.
How to Calculate the 52-Week Low?
Calculating the 52-week low involves tracking the lowest price a financial asset or security has reached during the past 52 weeks (12 months).
The calculation does not rely on a formula but instead requires access to historical price data. Investors can retrieve this information from financial websites, trading platforms, or stock exchanges.
For instance, if a stock’s price has ranged between $20 and $50 over the last 52 weeks, its 52-week low is $20. A stock trading near its 52-week low often draws attention as it may signal undervaluation or ongoing challenges for the underlying business.
Why is 52-Week Low Important?
The 52-week low is a valuable metric for evaluating market sentiment and identifying potential investment opportunities. By understanding the factors driving price movements, investors can better assess whether a stock near its 52-week low aligns with their portfolio strategy.
Here are some of the key indications of a 52-week low value:
Benchmark for Valuation
The 52-week low acts as a reference point for determining whether a stock is undervalued. Stocks trading near this level may indicate pessimism, but they could also offer entry points for long-term investors seeking bargains.
For instance, during bear markets, numerous stocks reach this point, making it essential to distinguish between fundamentally weak companies and temporarily undervalued assets.
Indicator of Market Sentiment
A security near its 52-week low often reflects negative sentiment about the company or market sector. This drop might stem from external factors like economic downturns or internal issues such as declining earnings. Analysts use this level to assess whether market fears are overblown or justified.
Tool for Technical Analysis
Technical analysts use the 52-week low to identify support levels. If a stock breaks below this level, it might indicate continued weakness. Conversely, a rebound from this point could signal potential recovery.
Factors Contributing to 52-Week Lows
- Company-Specific Challenges: Poor earnings reports, leadership changes, or declining market share can drive stocks to new lows.
- Economic Downturns: Broad market sell-offs during economic slowdowns or crises typically push many stocks towards their 52-week lows.
- Market Cycles: Cyclical industries like commodities often experience price volatility, causing frequent breaches of 52-week highs and lows.
Strategies for Investing Near 52-Week Lows
Conduct Thorough Research
Before investing in a stock trading near its 52-week low, investigate the reasons behind the price drop. Review financial statements, industry trends, and analyst opinions to assess its potential recovery.
Compare With Fundamentals
Use financial ratios, such as price-to-earnings (P/E) or debt-to-equity (D/E), to evaluate whether the stock is trading below its intrinsic value. Stocks with strong fundamentals despite recent price declines may present buying opportunities.
Monitor Institutional Activity
Track insider transactions and institutional investor activity. Significant purchases by executives or large funds could signal confidence in the company’s future prospects.
Some Common Misconceptions About 52-Week Low
“It’s Always a Buying Opportunity”
While some investors view stocks at their 52-week lows as undervalued, it’s crucial to understand why the price has declined. Not all stocks rebound; some may face structural or industry-wide issues that limit future growth.
“It Signals the Stock Has Hit Bottom”
A 52-week low doesn’t guarantee the price won’t drop further. External factors, such as earnings reports, regulatory changes, or broader economic conditions, can still drive prices lower.
How to Find 52-Week Low?
InvestingPro offers detailed insights into companies’ 52-Week Low including sector benchmarks and competitor analysis.
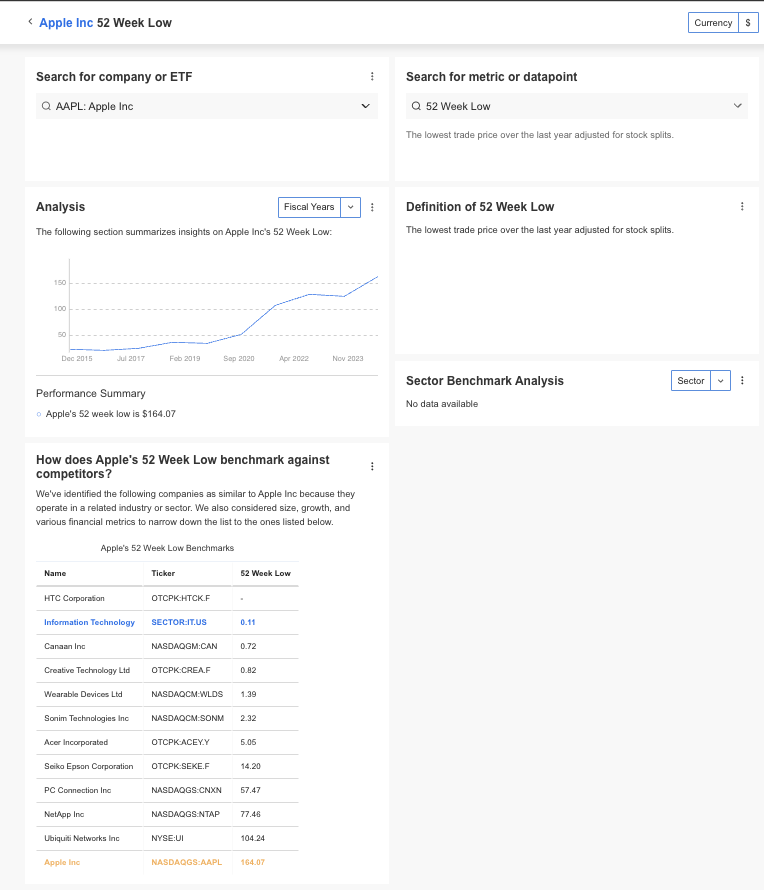
InvestingPro: Access 52-Week Low Data Instantly
Unlock Premium Data With InvestingPro 📈💸
Gain instant access to 52-Week Low data within the InvestingPro platform
🛠 Access to 1200+ additional fundamental metrics
🔍 Competitor comparison tools
📊 Evaluate stocks with 14+ proven financial models
52-Week Low FAQs
How can I find a stock’s 52-week low?
You can find this data on financial news websites, brokerage platforms, or directly from stock exchanges.
Does buying at the 52-week low guarantee profits?
No, investing at this level does not ensure gains. It’s vital to understand the underlying reasons for the low price and assess future potential. While a low price may suggest undervaluation, investors must analyze the company’s fundamentals and industry conditions before deciding.
Can a stock hit multiple 52-week lows?
Yes, a stock can repeatedly hit new 52-week lows during a prolonged downtrend.
Should I sell if my stock reaches a 52-week low?
Selling should depend on your investment goals and the company’s fundamentals rather than solely on the price level. These stocks may present risks but can also offer high rewards if the market’s fears are unfounded. Proper due diligence is essential.
Is the 52-week low relevant for all types of securities?
Yes, it applies to stocks, commodities, exchange-traded funds (ETFs), and other tradeable assets.
How does the 52-week low differ across industries?
Volatile sectors like technology or biotech may hit their lows more frequently compared to stable sectors like utilities.


