- English (UK)
- English (India)
- English (Canada)
- English (Australia)
- English (South Africa)
- English (Philippines)
- English (Nigeria)
- Deutsch
- Español (España)
- Español (México)
- Français
- Italiano
- Nederlands
- Polski
- Português (Portugal)
- Português (Brasil)
- Русский
- Türkçe
- العربية
- Ελληνικά
- Svenska
- Suomi
- עברית
- 日本語
- 한국어
- 简体中文
- 繁體中文
- Bahasa Indonesia
- Bahasa Melayu
- ไทย
- Tiếng Việt
- हिंदी

Allison Transmission Holdings Inc (ALSN)
Allison Transmission Holdings Inc stock price live, this page displays NYSE ALSN stock exchange data. View the ALSN premarket stock price ahead of the market session or assess the after hours quote. Monitor the latest movements within the Allison Transmission Holdings Inc real time stock price chart below.
What Is the Allison Transmission Holdings Inc Stock Price Today?
The Allison Transmission Holdings Inc stock price today is 125.82.
What Is the Stock Symbol for Allison Transmission Holdings Inc?
The stock ticker symbol for Allison Transmission Holdings Inc is ALSN.
Is ALSN the Same as $ALSN?
$ALSN is a common way to refer to the Allison Transmission Holdings Inc ticker symbol in social media, forums, and online discussions. The dollar sign is a shorthand convention used to indicate that it is a stock ticker symbol
What Stock Exchange Does Allison Transmission Holdings Inc Trade On?
Allison Transmission Holdings Inc is listed and trades on the NYSE stock exchange.
Is Allison Transmission Holdings Inc a Good Stock to Buy?
Determining whether Allison Transmission Holdings Inc—or any stock—is a good buy requires comprehensive analysis. To evaluate its potential, users can sign up to InvestingPro, where they can assess the current Allison Transmission Holdings Inc share price compared with the fair value and other essential metrics.
You can find more details by visiting the additional pages to view historical data, charts, latest news, analysis or visit the forum to view opinions on the ALSN quote. (ISIN: US01973R1014)
Currency in USD
Fair Value
An estimate of a stock's true price based on valuation models like discounted cash flow, peer valuation multiples, and dividend discount models.
Day's Range
124.85
128.34
52 wk Range
76.01
130.82
Earnings results expected in 14 days
1/2
Fair Value
An estimate of a stock's true price based on valuation models like discounted cash flow, peer valuation multiples, and dividend discount models.
Day's Range
124.85128.34
52 wk Range
76.01130.82
Key Statistics
Edit
Prev. Close
Open
Volume
Average Vol. (3m)
1-Year Change
Book Value / Share
Fair Value
Fair Value Upside
Market Cap
Shares Outstanding
Revenue
Net Income
EPS
EPS Growth Forecast
Next Earnings Date
(0.90%)
Dividends Payment Streak
P/E Ratio
Return on Assets
Return on Equity
Gross Profit Margin
Price/Book
EBITDA
EV/EBITDA
Beta
ALSN Scorecard
Company’s Health
Assesses a company's financial position by analyzing its market value, financial ratios, industry benchmarks, and competitors.
UnlockFair Value
An estimate of a stock's true price based on valuation models like discounted cash flow, peer valuation multiples, and dividend discount models.
Unlock PriceTechnical Analysis
Strong Buy
Price Target
131.00
Upside
+4.12%
Members' Sentiments
Bearish
Bullish
ProTips
Tips that distill complex financial data into concise, actionable investment insights.
Analysts anticipate sales growth in the current year
- Raymond James top ranked stocks for March, by sector
- Investing.com
- Raymond James top ranked stocks for March, by sector
- Investing.com
Technical Analysis
Summary
Strong Sell
Sell
Neutral
Buy
Strong Buy
Neutral
Technical Indicators
Strong Sell
Moving Averages
Buy
Allison Transmission Holdings, Inc., together with its subsidiaries, designs, manufactures, and sells fully automatic transmissions for medium- and heavy-duty commercial vehicles and medium- and heavy-tactical U.S. defense vehicles, and electrified propulsion systems worldwide. It offers transmissions for various applications, including distribution, refuse, construction, fire, and emergency on-highway trucks; school and transit buses; motor homes; energy, mining, and construction of off-highway vehicles and equipment; and wheeled and tracked defense vehicles. The company also provides its transmissions and electric propulsion solutions under the Allison Transmission brand name; and remanufactured transmissions under the ReTran brand name. In addition, it sells branded replacement parts, support equipment, aluminum die cast components, and other products necessary to service the installed base of vehicles utilizing its solutions, as well as defense kits, engineering services, and extended transmission coverage services to various original equipment manufacturers, distributors, and the U.S. government. The company was formerly known as Clutch Holdings, Inc. Allison Transmission Holdings, Inc. was founded in 1915 and is headquartered in Indianapolis, Indiana.
Allison Transmission Holdings Inc Earnings Call Summary for Q4/2025
- Q4 EPS of $1.18 missed forecast by 21.85%; revenue of $737M beat estimates by 2.49%, stock fell 1.69% after-hours to $118.85
- Full-year 2025 revenue declined 7%; adjusted EBITDA margin expanded 140 bps to 37.5% driven by operational discipline and cost controls
- Defense sector revenue surged 26% meeting targets; international markets achieved record revenue despite challenging macroeconomic conditions
- Q4 operating cash flow of $243M up $32M YoY; company maintains aggressive share buybacks and six consecutive years of dividend increases
- 2026 outlook shows EPS recovery to $1.59 in Q1 and $2.10 in Q4; full-year revenue projected at $5.55B amid trade policy uncertainties
Last Updated: 02/23/2026, 06:17 PM
Read Full TranscriptAllison Transmission investor slides for Q4/2025
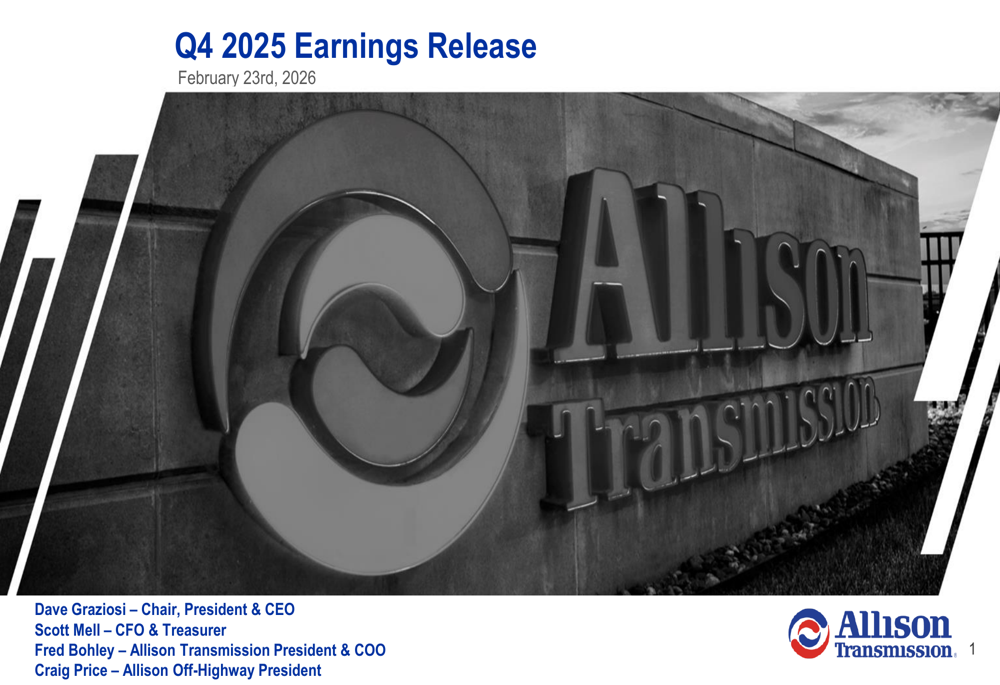
Last Update: Feb 23, 2026
See full investor slides
Compare ALSN to Peers and Sector
Metrics to compare | ALSN | Sector Sector - Average of metrics from a broad group of related Industrials sector companies | Relationship RelationshipALSNPeersSector | |
|---|---|---|---|---|
P/E Ratio | 16.8x | 21.2x | 12.5x | |
PEG Ratio | −1.45 | 1.56 | 0.03 | |
Price / Book | 5.6x | 4.4x | 1.4x | |
Price / LTM Sales | 3.5x | 2.1x | 1.3x | |
Upside (Analyst Target) | 2.9% | 43.1% | 19.8% | |
Fair Value Upside | Unlock | −4.0% | 5.9% | Unlock |
Analyst Ratings
3 Buy
6 Hold
1 Sell
Ratings:
10 analysts
Overall Consensus
Buy
Analysts 12-Month Price Target:
Average 131.00
(+4.12% Upside)
Earnings
Latest Release
Feb 23, 2026
EPS / Forecast
1.18 / 1.51
Revenue / Forecast
737M / 719.06M
People Also Watch
FAQ
What Is the Allison Transmission (ALSN) Stock Price Today?
The Allison Transmission stock price today is 125.82 USD.
What Stock Exchange Does Allison Transmission Trade On?
Allison Transmission is listed and trades on the New York Stock Exchange.
What Is the Stock Symbol for Allison Transmission?
The stock symbol for Allison Transmission is "ALSN."
Does Allison Transmission Pay Dividends? What’s The Current Dividend Yield?
The Allison Transmission dividend yield is 0.9%.
What Is the Allison Transmission Market Cap?
As of today, Allison Transmission market cap is 10.48B USD.
What Is Allison Transmission's Earnings Per Share (TTM)?
The Allison Transmission EPS (TTM) is 7.33.
When Is the Next Allison Transmission Earnings Date?
Allison Transmission will release its next earnings report on Apr 29, 2026.
From a Technical Analysis Perspective, Is ALSN a Buy or Sell?
Based on moving averages and other technical indicators, the daily buy/sell signal is Strong Buy.
How Many Times Has Allison Transmission Stock Split?
Allison Transmission has split 0 times.
How Many Employees Does Allison Transmission Have?
Allison Transmission has 4000 employees.
What is the current trading status of Allison Transmission (ALSN)?
As of Apr 15, 2026, Allison Transmission (ALSN) is trading at a price of 125.82 USD, with a previous close of 128.26 USD. The stock has fluctuated within a day range of 124.85 USD to 128.34 USD, while its 52-week range spans from 76.01 USD to 130.82 USD.
What Is Allison Transmission (ALSN) Price Target According to Analysts?
The average 12-month price target for Allison Transmission is 131.00 USD, with a high estimate of 185 USD and a low estimate of 95 USD. 3 analysts recommend buying the stock, while 1 suggest selling, leading to an overall rating of Buy. The stock has an +4.12% Upside potential.
What Is the ALSN Premarket Price?
ALSN's last pre-market stock price is 128.87 USD. The pre-market share volume is 50.00, and the stock has decreased by 0.61, or 0.48%.
What Is the ALSN After Hours Price?
ALSN's last after hours stock price is 125.82 USD, the stock has decreased by -0.05, or -0.04%.
Install Our App
Risk Disclosure: Trading in financial instruments and/or cryptocurrencies involves high risks including the risk of losing some, or all, of your investment amount, and may not be suitable for all investors. Prices of cryptocurrencies are extremely volatile and may be affected by external factors such as financial, regulatory or political events. Trading on margin increases the financial risks.
Before deciding to trade in financial instrument or cryptocurrencies you should be fully informed of the risks and costs associated with trading the financial markets, carefully consider your investment objectives, level of experience, and risk appetite, and seek professional advice where needed.
Fusion Media would like to remind you that the data contained in this website is not necessarily real-time nor accurate. The data and prices on the website are not necessarily provided by any market or exchange, but may be provided by market makers, and so prices may not be accurate and may differ from the actual price at any given market, meaning prices are indicative and not appropriate for trading purposes. Fusion Media and any provider of the data contained in this website will not accept liability for any loss or damage as a result of your trading, or your reliance on the information contained within this website.
It is prohibited to use, store, reproduce, display, modify, transmit or distribute the data contained in this website without the explicit prior written permission of Fusion Media and/or the data provider. All intellectual property rights are reserved by the providers and/or the exchange providing the data contained in this website.
Fusion Media may be compensated by the advertisers that appear on the website, based on your interaction with the advertisements or advertisers.
© 2007-2026 - Fusion Media Limited. All Rights Reserved.