- English (UK)
- English (India)
- English (Canada)
- English (Australia)
- English (South Africa)
- English (Philippines)
- English (Nigeria)
- Deutsch
- Español (España)
- Español (México)
- Français
- Italiano
- Nederlands
- Polski
- Português (Portugal)
- Português (Brasil)
- Русский
- Türkçe
- العربية
- Ελληνικά
- Svenska
- Suomi
- עברית
- 日本語
- 한국어
- 简体中文
- 繁體中文
- Bahasa Indonesia
- Bahasa Melayu
- ไทย
- Tiếng Việt
- हिंदी

Tamboran Resources Corp (TBN)
Tamboran Resources Corp stock price live, this page displays NYSE TBN stock exchange data. View the TBN premarket stock price ahead of the market session or assess the after hours quote. Monitor the latest movements within the Tamboran Resources Corp real time stock price chart below.
What Is the Tamboran Resources Corp Stock Price Today?
The Tamboran Resources Corp stock price today is 35.11.
What Is the Stock Symbol for Tamboran Resources Corp?
The stock ticker symbol for Tamboran Resources Corp is TBN.
Is TBN the Same as $TBN?
$TBN is a common way to refer to the Tamboran Resources Corp ticker symbol in social media, forums, and online discussions. The dollar sign is a shorthand convention used to indicate that it is a stock ticker symbol
What Stock Exchange Does Tamboran Resources Corp Trade On?
Tamboran Resources Corp is listed and trades on the NYSE stock exchange.
Is Tamboran Resources Corp a Good Stock to Buy?
Determining whether Tamboran Resources Corp—or any stock—is a good buy requires comprehensive analysis. To evaluate its potential, users can sign up to InvestingPro, where they can assess the current Tamboran Resources Corp share price compared with the fair value and other essential metrics.
You can find more details by visiting the additional pages to view historical data, charts, latest news, analysis or visit the forum to view opinions on the TBN quote. (ISIN: US87507T1016)
35.11
-0.34(-0.97%)
Real-time Data·
Fair Value
An estimate of a stock's true price based on valuation models like discounted cash flow, peer valuation multiples, and dividend discount models.
Day's Range
34.85
35.89
52 wk Range
17.29
52.21
TBN is not included in our AI-picked strategies. See which stocks are.
Fair Value
An estimate of a stock's true price based on valuation models like discounted cash flow, peer valuation multiples, and dividend discount models.
Day's Range
34.8535.89
52 wk Range
17.2952.21
Key Statistics
Edit
Prev. Close
Open
Volume
Average Vol. (3m)
1-Year Change
Book Value / Share
Fair Value
Fair Value Upside
Market Cap
Shares Outstanding
Revenue
Net Income
EPS
EPS Growth Forecast
Next Earnings Date
N/A
(N/A)
Dividends Payment Streak
P/E Ratio
Return on Assets
Return on Equity
Gross Profit Margin
Price/Book
EBITDA
EV/EBITDA
Beta
TBN Scorecard
Company’s Health
Assesses a company's financial position by analyzing its market value, financial ratios, industry benchmarks, and competitors.
UnlockFair Value
An estimate of a stock's true price based on valuation models like discounted cash flow, peer valuation multiples, and dividend discount models.
Unlock PriceTechnical Analysis
Neutral
Analysts Sentiment
Strong Buy
Price Target
62.67
Upside
+78.49%
Members' Sentiments
Bearish
Bullish
ProTips
Tips that distill complex financial data into concise, actionable investment insights.
Quickly burning through cash
- Form 8K Tamboran Resources Corp For: 14 April
- Investing.com
- Form 8K TAMBORAN RESOURCES CORPORATION For: 9 April
- Investing.com
- Form 8K Tamboran Resources Corp For: 14 April
- Investing.com
- Form 8K TAMBORAN RESOURCES CORPORATION For: 9 April
- Investing.com
Technical Analysis
Summary
Strong Sell
Sell
Neutral
Buy
Strong Buy
Strong Sell
Technical Indicators
Strong Sell
Moving Averages
Strong Sell
Tamboran Resources Corporation, a natural gas company, engages in developing unconventional gas resources in the northern territory of Australia. Its assets include a 25% non-operated working interest in EP 161; a 38.75% working interest in EPs 76, 98, and 117; and a 100% working interest in EPs 136 and 143, as well as EP (A) 197, located in the Betaloo Basin. Tamboran Resources Corporation was founded in 2009 and is headquartered in Sydney, Australia.
Tamboran Resources Corp Earnings Call Summary for Q2/2026
- Tamboran Resources reported a cash balance of $91 million at the end of 2025, with $16.3 million in debt and an additional $32 million from a recent PIPE transaction.
- The company is targeting first gas sales by Q3 2026, with the Sturt Plateau Compression Facility already 80% complete and plans to expand capacity to 100 million cubic feet per day.
- Strategic focus has shifted toward Northern Territory and Asia LNG markets, with revenue projections of $30.89 million for FY2026 and $78.49 million for FY2027.
- Despite identifying potential impediments in recent well stimulations, management remains confident, with CEO Todd Abbott emphasizing 'drilling great gas wells' as a priority.
Last Updated: 02/11/2026, 05:44 PM
Read Full TranscriptTamboran Resources investor slides for Q2/2026
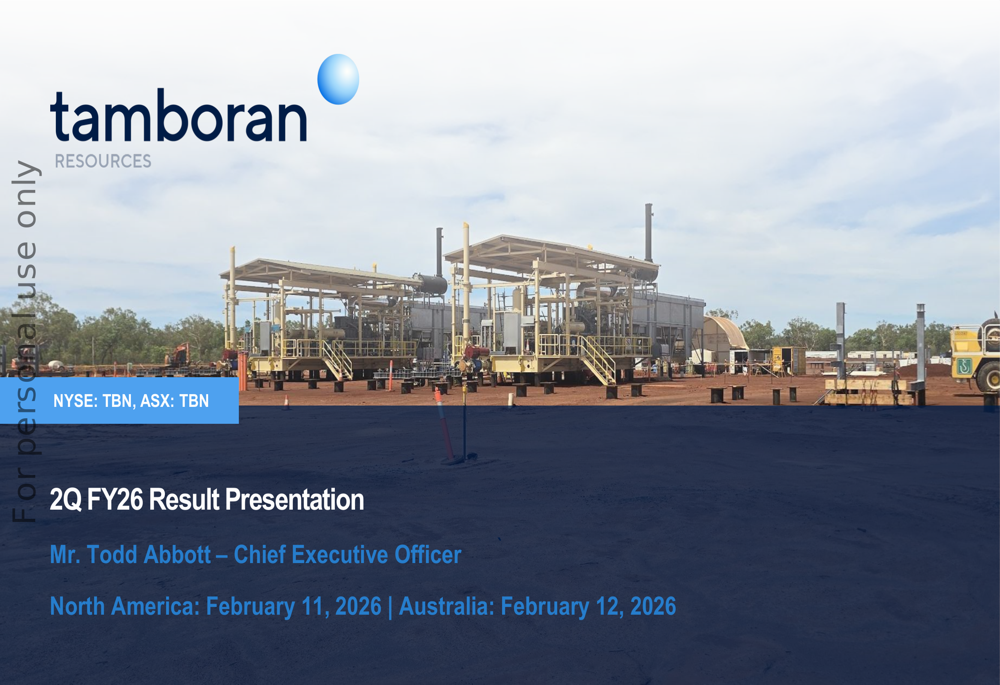
Last Update: Feb 11, 2026
See full investor slides
Compare TBN to Peers and Sector
Metrics to compare | TBN | Sector Sector - Average of metrics from a broad group of related Energy sector companies | Relationship RelationshipTBNPeersSector | |
|---|---|---|---|---|
P/E Ratio | −28.9x | −6.8x | 6.9x | |
PEG Ratio | −0.96 | 0.01 | 0.00 | |
Price / Book | 2.5x | 1.2x | 1.1x | |
Price / LTM Sales | - | 4.0x | 1.5x | |
Upside (Analyst Target) | 77.0% | 84.3% | 16.1% | |
Fair Value Upside | Unlock | −2.3% | 4.8% | Unlock |
Analyst Ratings
6 Buy
0 Hold
0 Sell
Ratings:
6 analysts
Overall Consensus
Strong Buy
Analysts 12-Month Price Target:
Average 62.67
(+78.49% Upside)
Earnings
Latest Release
Feb 10, 2026
EPS / Forecast
-64.76 / --
Revenue / Forecast
-- / --
People Also Watch
FAQ
What Is the Tamboran Resources (TBN) Stock Price Today?
The Tamboran Resources stock price today is 35.11 USD.
What Stock Exchange Does Tamboran Resources Trade On?
Tamboran Resources is listed and trades on the New York Stock Exchange.
What Is the Stock Symbol for Tamboran Resources?
The stock symbol for Tamboran Resources is "TBN."
What Is the Tamboran Resources Market Cap?
As of today, Tamboran Resources market cap is 940.97M USD.
What Is Tamboran Resources's Earnings Per Share (TTM)?
The Tamboran Resources EPS (TTM) is -0.01.
When Is the Next Tamboran Resources Earnings Date?
Tamboran Resources will release its next earnings report on May 14, 2026.
From a Technical Analysis Perspective, Is TBN a Buy or Sell?
Based on moving averages and other technical indicators, the daily buy/sell signal is Neutral.
How Many Times Has Tamboran Resources Stock Split?
Tamboran Resources has split 0 times.
How Many Employees Does Tamboran Resources Have?
Tamboran Resources has 47 employees.
What is the current trading status of Tamboran Resources (TBN)?
As of Apr 15, 2026, Tamboran Resources (TBN) is trading at a price of 35.11 USD, with a previous close of 35.45 USD. The stock has fluctuated within a day range of 34.85 USD to 35.89 USD, while its 52-week range spans from 17.29 USD to 52.21 USD.
What Is Tamboran Resources (TBN) Price Target According to Analysts?
The average 12-month price target for Tamboran Resources is 62.67 USD, with a high estimate of 74 USD and a low estimate of 53 USD. 6 analysts recommend buying the stock, while 0 suggest selling, leading to an overall rating of Strong Buy. The stock has an +78.49% Upside potential.
What Is the TBN Premarket Price?
TBN's last pre-market stock price is 34.83 USD. The pre-market share volume is 70.00, and the stock has decreased by -0.62, or -1.75%.
What Is the TBN After Hours Price?
TBN's last after hours stock price is 34.83 USD, the stock has decreased by -0.62, or -1.75%.
Install Our App
Risk Disclosure: Trading in financial instruments and/or cryptocurrencies involves high risks including the risk of losing some, or all, of your investment amount, and may not be suitable for all investors. Prices of cryptocurrencies are extremely volatile and may be affected by external factors such as financial, regulatory or political events. Trading on margin increases the financial risks.
Before deciding to trade in financial instrument or cryptocurrencies you should be fully informed of the risks and costs associated with trading the financial markets, carefully consider your investment objectives, level of experience, and risk appetite, and seek professional advice where needed.
Fusion Media would like to remind you that the data contained in this website is not necessarily real-time nor accurate. The data and prices on the website are not necessarily provided by any market or exchange, but may be provided by market makers, and so prices may not be accurate and may differ from the actual price at any given market, meaning prices are indicative and not appropriate for trading purposes. Fusion Media and any provider of the data contained in this website will not accept liability for any loss or damage as a result of your trading, or your reliance on the information contained within this website.
It is prohibited to use, store, reproduce, display, modify, transmit or distribute the data contained in this website without the explicit prior written permission of Fusion Media and/or the data provider. All intellectual property rights are reserved by the providers and/or the exchange providing the data contained in this website.
Fusion Media may be compensated by the advertisers that appear on the website, based on your interaction with the advertisements or advertisers.
© 2007-2026 - Fusion Media Limited. All Rights Reserved.